Operations dashboard for a multi-location physical therapy group
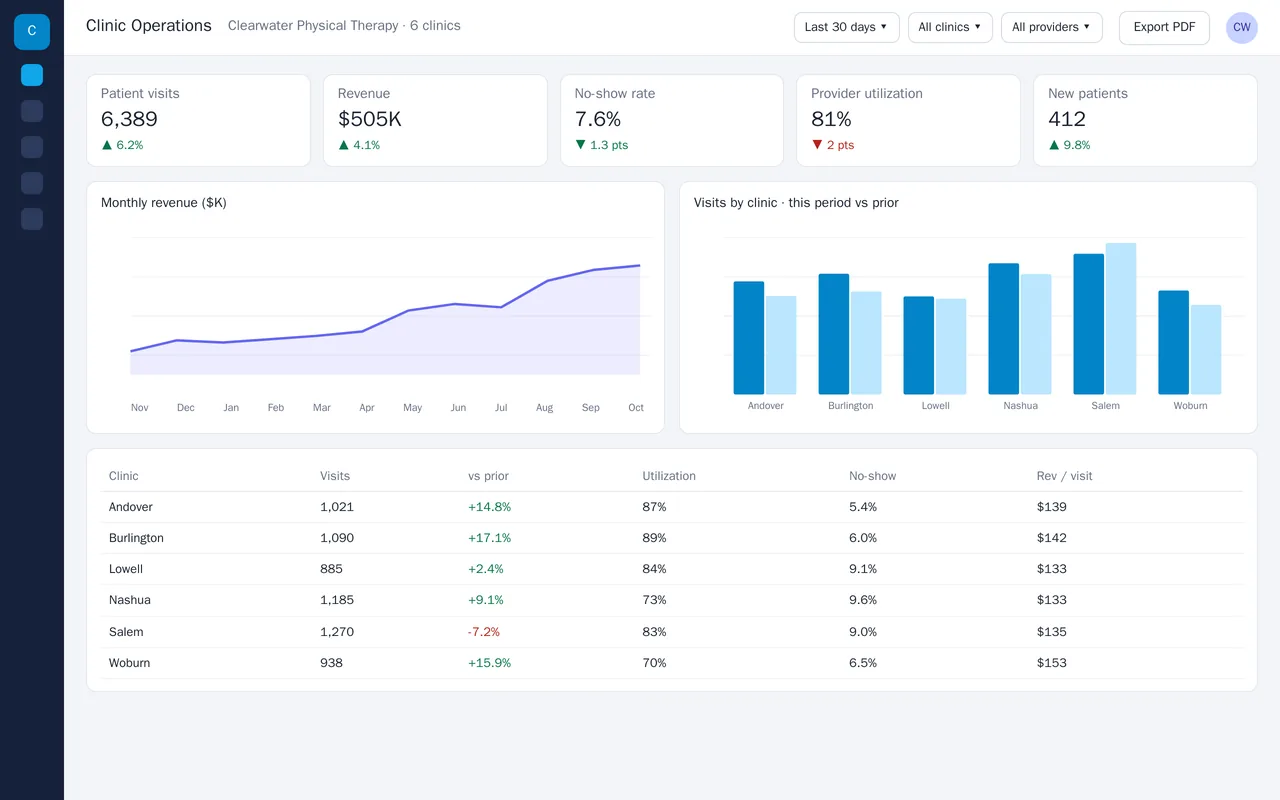
Clearwater Physical Therapy runs six clinics, and the owners were building a monthly report by exporting spreadsheets from three systems. We built a dashboard that pulls scheduling, billing and staffing data every night and shows visits, revenue, no-shows, provider utilization and new patients by clinic and provider. Filters cover date range, clinic and provider, and a one-click PDF goes to the partners each month. Only aggregate numbers are shown; no patient details leave the source systems.
- Nightly data pipeline from scheduling, billing and payroll exports into one database
- KPI dashboard with period-over-period comparisons
- Revenue trend, visits by clinic, and a per-clinic league table
- Filters by date, clinic and provider; monthly PDF report by email
Python, dbt, PostgreSQL, React + Recharts, scheduled PDF export, Docker