
Example build
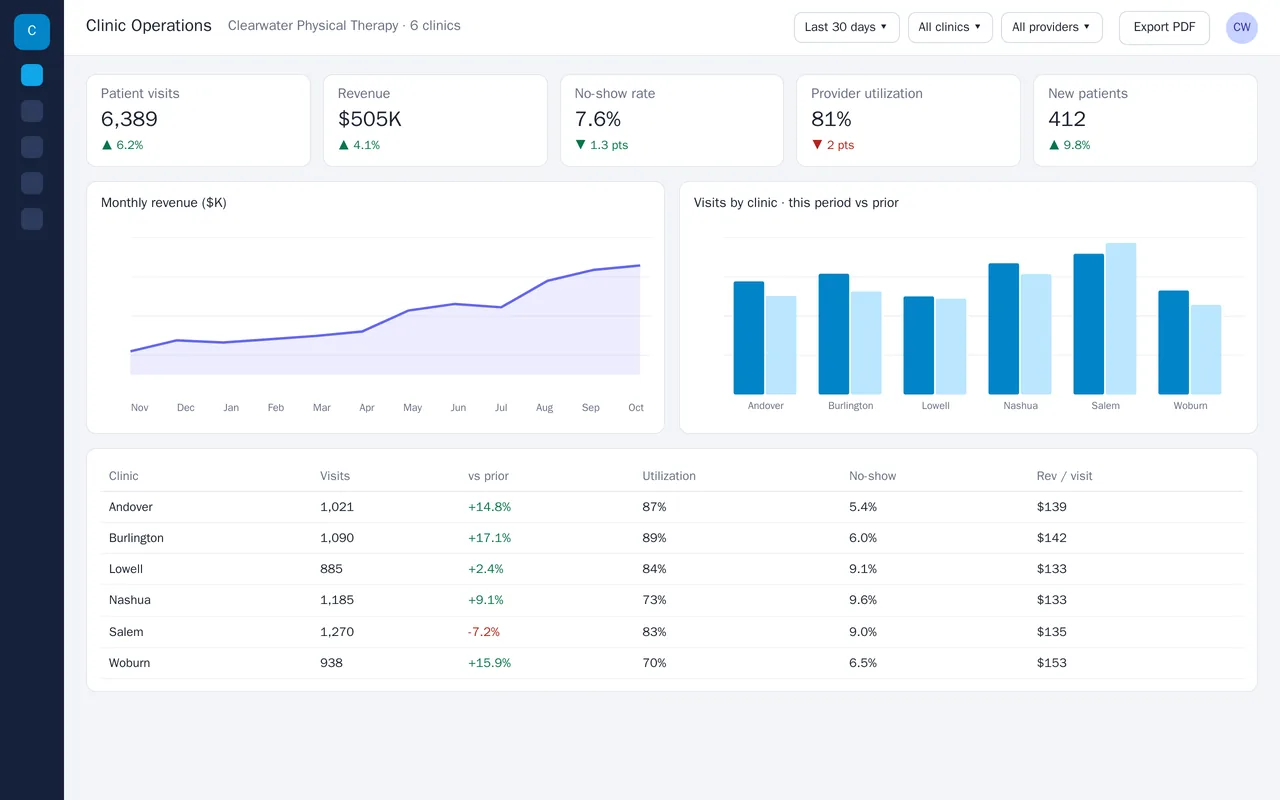
Operations dashboard for a multi-location physical therapy group
- Nightly data pipeline from scheduling, billing and payroll exports into one database
- KPI dashboard with period-over-period comparisons
- Revenue trend, visits by clinic, and a per-clinic league table
- Filters by date, clinic and provider; monthly PDF report by email
Python, dbt, PostgreSQL, React + Recharts, scheduled PDF export, Docker