
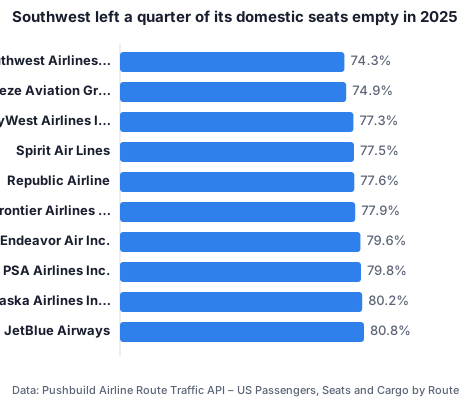
Southwest left a quarter of its domestic seats empty in 2025
Published 2026-11-07 · By Pushbuild · Data: Airline Route Traffic API – US Passengers, Seats and Cargo by Route
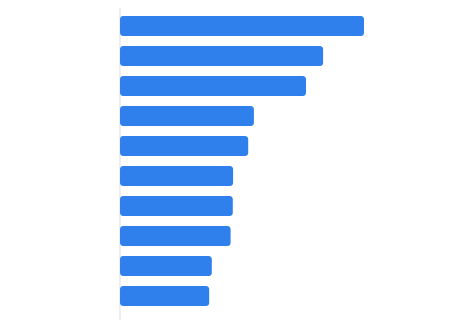
Southwest filled 74.3% of its domestic seats in 2025, the lowest of any large US airline; Delta filled 82.7%.
“TranStats provides one-stop shopping for intermodal transportation data for researchers, decision-makers, as well as the general public interested in transportation issues.”
— Bureau of Transportation Statistics, T-100 Segment (All Carriers)
| Airline | Passengers | Seats | Seats filled |
|---|---|---|---|
| Southwest Airlines Co. | 165,845,814 | 223,187,191 | 74.3% |
| Breeze Aviation Group DBA Breeze | 6,272,898 | 8,375,590 | 74.9% |
| SkyWest Airlines Inc. | 44,096,742 | 57,034,891 | 77.3% |
| Spirit Air Lines | 28,668,063 | 36,990,211 | 77.5% |
| Republic Airline | 19,552,803 | 25,197,149 | 77.6% |
| Frontier Airlines Inc. | 31,685,561 | 40,680,704 | 77.9% |
| Endeavor Air Inc. | 14,015,556 | 17,611,827 | 79.6% |
| PSA Airlines Inc. | 13,621,931 | 17,073,768 | 79.8% |
| Alaska Airlines Inc. | 33,200,065 | 41,415,680 | 80.2% |
| JetBlue Airways | 28,565,492 | 35,353,521 | 80.8% |
| Hawaiian Airlines Inc. | 10,589,608 | 13,058,662 | 81.1% |
| Envoy Air | 17,396,140 | 21,435,404 | 81.2% |
| Horizon Air | 5,979,154 | 7,348,440 | 81.4% |
| American Airlines Inc. | 132,093,389 | 162,172,404 | 81.5% |
| Allegiant Air | 18,824,033 | 23,106,734 | 81.5% |
| United Air Lines Inc. | 109,998,660 | 135,035,880 | 81.5% |
| Delta Air Lines Inc. | 138,819,819 | 167,948,190 | 82.7% |
| Piedmont Airlines | 6,046,494 | 7,248,386 | 83.4% |
Caveats
Domestic segments, carriers with 5M+ passengers. Load factor by seats, not miles.
Sources
- Bureau of Transportation Statistics, T-100 Segment (All Carriers), read through the Pushbuild Airline Route Traffic API on 2026-11-07
Data as of 2026-11-07. Every figure in this post is in the table above and the CSV below.
Download the data behind this post: b4-t100-load-factor-by-carrier-2025.csv
Get this data
Every number in this post comes from the Airline Route Traffic API – US Passengers, Seats and Cargo by Route. $0.0008 per row returned; every key gets $1 of free usage each month.
curl -X POST https://api.pushbuild.com/airline-route-traffic/run \
  -H "X-API-Key: YOUR_KEY" \
  -H "Content-Type: application/json" \
-d '{"airports": ["BOS"], "maxItems": 20}'Embed this chart
Free to reuse with the credit link. Paste this HTML into your page, or use the SVG file.
Want a table like this in Google Sheets, refreshed on demand? Free script: copy a web table into Google Sheets.
Related analysis
What were the busiest US domestic air routes in 2025?
New York JFK–Los Angeles was the busiest US domestic route in 2025, with 2,912,963 passengers, followed by LaGuardia–Chicago O'Hare (2,769,621) and…
The routes that vanished, and the ones that doubled
Newark–Chicago Midway went from 322,232 passengers in 2019 to 10,282 in 2025 (-96.8%). Bozeman–Denver went from 306,176 to 667,832 (+118%), and…
Airlines reported 20,426 cracks to the FAA since January 2025
Of 118,407 mechanical-difficulty reports filed since January 2025, 20,426 describe a crack. The parts reported most were fuselage skin (6,782), seat…



Want this data inside your own app or CRM? API integrations and data sync