
Chicago schools fail food inspections more often than restaurants
Published 2026-11-07 · By Pushbuild · Data: Restaurant Inspections API – Health Scores, Grades and Violations
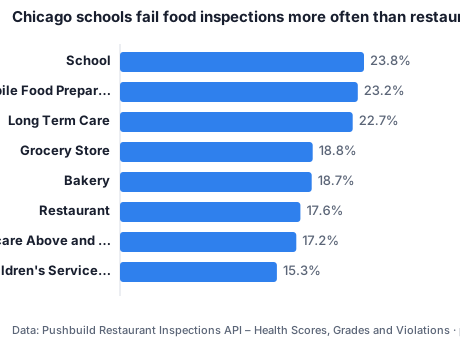
Since 2024, 23.8% of Chicago school kitchen inspections ended in "Fail", against 17.6% for restaurants. Long-term care facilities (22.7%) also fail more often than restaurants.
| Facility type | Inspections | Fail rate |
|---|---|---|
| School | 3,182 | 23.8% |
| Mobile Food Preparer | 392 | 23.2% |
| Long Term Care | 476 | 22.7% |
| Grocery Store | 4,872 | 18.8% |
| Bakery | 726 | 18.7% |
| Restaurant | 37,085 | 17.6% |
| Daycare Above and Under 2 Years | 720 | 17.2% |
| Children's Services Facility | 1,837 | 15.3% |
Caveats
Chicago Department of Public Health inspections, Jan 2024 to Nov 2026; types with 300+ inspections.
Sources
- Restaurant Inspections API – Health Scores, Grades and Violations: the primary sources are listed on the API page, read on 2026-11-07
Data as of 2026-11-07. Every figure in this post is in the table above and the CSV below.
Download the data behind this post: b1-chicago-fail-rate-by-facility-type-2024-26.csv
Get this data
Every number in this post comes from the Restaurant Inspections API – Health Scores, Grades and Violations. $0.0008 per row returned; every key gets $1 of free usage each month.
curl -X POST https://api.pushbuild.com/restaurant-inspections/run \
  -H "X-API-Key: YOUR_KEY" \
  -H "Content-Type: application/json" \
-d '{"jurisdictions": ["nyc"], "name": "pizza", "maxItems": 20}'Embed this chart
Free to reuse with the credit link. Paste this HTML into your page, or use the SVG file.
Want a table like this in Google Sheets, refreshed on demand? Free script: copy a web table into Google Sheets.
Related analysis
The places that keep failing: 26 failed inspections at one Boston hot dog stand
Boston's most-failed food business since 2023 is Dans Mini Dogs at 1010 Massachusetts Ave, with 26 failed inspections. In Chicago, JJ Fish on S…
NYC inspectors found mice at 7,225 restaurants since 2024
Evidence of mice was cited in 11,066 New York City restaurant inspections since January 2024, at 7,225 different restaurants. Rats were cited in…
Colorado dentists carry discipline records at nearly three times the rate of physicians
177.8 of every 1,000 Colorado dentist licenses carry a discipline record, against 64.4 for physicians. Chiropractors (125.5) and pharmacists (100.1)…


Want this data inside your own app or CRM? API integrations and data sync