
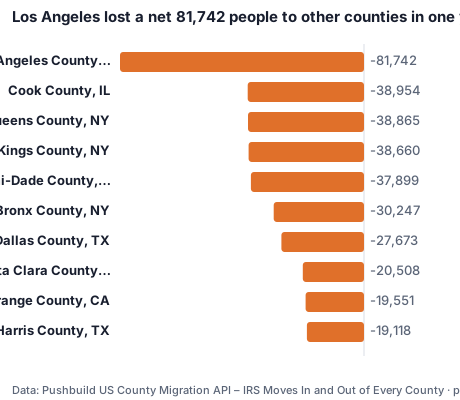
Los Angeles lost a net 81,742 people to other counties in one year
Published 2026-11-07 · By Pushbuild · Data: US County Migration API – IRS Moves In and Out of Every County
In 2022-23, Los Angeles County lost 81,742 more people to other US counties than it gained, taking $4.1 billion in income with them. Cook County (Chicago) lost 38,954 and $4.1 billion; Queens, Brooklyn and the Bronx together lost 107,772. Polk and Pasco counties in Florida gained the most.
Biggest net losses
| County | Net people | Net income ($M) |
|---|---|---|
| Los Angeles County, CA | -81,742 | -4,089 |
| Cook County, IL | -38,954 | -4,149 |
| Queens County, NY | -38,865 | -1,788 |
| Kings County, NY | -38,660 | -774 |
| Miami-Dade County, FL | -37,899 | 438 |
| Bronx County, NY | -30,247 | -982 |
| Dallas County, TX | -27,673 | -1,174 |
| Santa Clara County, CA | -20,508 | -2,659 |
| Orange County, CA | -19,551 | -524 |
| Harris County, TX | -19,118 | -1,199 |
| Philadelphia County, PA | -16,638 | -990 |
| Alameda County, CA | -15,760 | -1,147 |
Biggest net gains
| County | Net people | Net income ($M) |
|---|---|---|
| Polk County, FL | +19,407 | 598 |
| Pasco County, FL | +18,561 | 895 |
| Collin County, TX | +18,014 | 915 |
| Montgomery County, TX | +17,362 | 840 |
| Williamson County, TX | +14,769 | 997 |
| Denton County, TX | +14,119 | 1,207 |
| Pinal County, AZ | +14,108 | 590 |
| Lake County, FL | +11,522 | 619 |
| Clark County, NV | +11,396 | 1,246 |
| Riverside County, CA | +10,844 | 527 |
| St. Lucie County, FL | +10,451 | 488 |
| Fort Bend County, TX | +10,156 | 144 |
Caveats
IRS tax-return addresses, 2022 to 2023 filing years, county-to-county flows the IRS publishes (small flows are not itemized). People are filers plus dependents. International moves are not counted.
Sources
- IRS Statistics of Income, migration data, read through the Pushbuild US County Migration API on 2026-11-07
Data as of 2026-11-07. Every figure in this post is in the table above and the CSV below.
Download the data behind this post: b3-migration-top-net-loss-counties-2022-23.csv · b3-migration-top-net-gain-counties-2022-23.csv
Get this data
Every number in this post comes from the US County Migration API – IRS Moves In and Out of Every County. $0.0008 per row returned; every key gets $1 of free usage each month.
curl -X POST https://api.pushbuild.com/us-county-migration/run \
  -H "X-API-Key: YOUR_KEY" \
  -H "Content-Type: application/json" \
-d '{"county": "Travis", "state": "TX", "maxItems": 20}'Embed this chart
Free to reuse with the credit link. Paste this HTML into your page, or use the SVG file.
Want a table like this in Google Sheets, refreshed on demand? Free script: copy a web table into Google Sheets.
Related analysis
Florida gained $15.5 billion in income from movers in one year
People moving to Florida from other states in 2022-23 brought $15.5 billion more in adjusted gross income than people leaving took out. Texas gained…
America's biggest move: 34,872 people from Los Angeles to San Bernardino
The largest single county-to-county flow in 2022-23 was Los Angeles to San Bernardino, 34,872 people. Six of the top ten were within Texas metros,…
More than a quarter of Mississippi tax returns claim the Earned Income Tax Credit
26.9% of Mississippi returns claimed the EITC in 2023, the highest share of any state; Louisiana was 24.2%, Georgia…




Want this data inside your own app or CRM? API integrations and data sync