
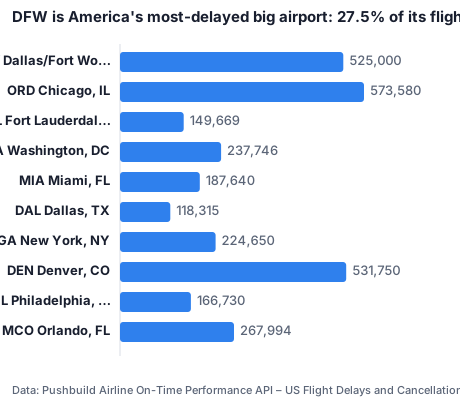
DFW is America's most-delayed big airport: 27.5% of its flights arrive late
Published 2026-11-07 · By Pushbuild · Data: Airline On-Time Performance API – US Flight Delays and Cancellations
Since January 2025, 27.53% of flights leaving Dallas/Fort Worth arrived 15+ minutes late, the worst of any airport with 20,000+ departures. Chicago O'Hare (27.23%) and Fort Lauderdale (26.64%) follow. Washington National cancelled 4.37% of departures. Among airlines, Frontier was late most often (27.54%) and Delta least among the big four (19.3%).
“Airline on-time data are reported in 2021 to the U.S. Department of Transportation (DOT), Bureau of Transportation Statistics (BTS) by the 17 U.S. air carriers that have at least 0.5 percent of total domestic scheduled-service passenger revenues.”
— Bureau of Transportation Statistics, Airline On-Time Statistics
| Airport | Departures | Arrived 15+ min late | Cancelled | Avg arrival delay (min) |
|---|---|---|---|---|
| DFW Dallas/Fort Worth, TX | 525,000 | 27.53% | 2.87% | 14.7 |
| ORD Chicago, IL | 573,580 | 27.23% | 2.32% | 14.4 |
| FLL Fort Lauderdale, FL | 149,669 | 26.64% | 1.97% | 12.9 |
| DCA Washington, DC | 237,746 | 26.43% | 4.37% | 14.0 |
| MIA Miami, FL | 187,640 | 25.97% | 1.54% | 11.8 |
| DAL Dallas, TX | 118,315 | 25.93% | 1.51% | 10.1 |
| LGA New York, NY | 224,650 | 25.14% | 4.26% | 11.1 |
| DEN Denver, CO | 531,750 | 25.1% | 0.81% | 10.6 |
| PHL Philadelphia, PA | 166,730 | 25.03% | 2.86% | 12.1 |
| MCO Orlando, FL | 267,994 | 24.99% | 1.5% | 11.3 |
| PBI West Palm Beach/Palm Beach, FL | 50,119 | 24.65% | 2.2% | 13.3 |
| CLT Charlotte, NC | 315,043 | 24.57% | 2.11% | 10.9 |
Airlines
| Carrier | Flights | Late 15+ | Cancelled |
|---|---|---|---|
| HA | 80,084 | 17.12% | 0.82% |
| DL | 1,721,263 | 19.3% | 1.45% |
| MQ | 517,046 | 19.71% | 2.27% |
| YX | 592,269 | 20.39% | 4.12% |
| OO | 1,416,733 | 20.93% | 1.58% |
| UA | 1,354,575 | 21.29% | 0.99% |
| AS | 473,194 | 21.35% | 1.18% |
| WN | 2,319,717 | 22.9% | 0.92% |
| NK | 241,717 | 23.29% | 2.67% |
| AA | 1,641,071 | 25.23% | 2.15% |
| G4 | 218,341 | 25.56% | 0.6% |
| OH | 411,822 | 26.12% | 5.19% |
| B6 | 397,034 | 26.64% | 2.76% |
| F9 | 345,485 | 27.54% | 2.01% |
Caveats
BTS on-time data, Jan 2025 to Aug 2026, reporting carriers only. Carrier codes: OH is PSA, YX Republic, OO SkyWest, MQ Envoy, G4 Allegiant.
Sources
- Bureau of Transportation Statistics, Airline On-Time Statistics, read through the Pushbuild Airline On-Time Performance API on 2026-11-07
Data as of 2026-11-07. Every figure in this post is in the table above and the CSV below.
Download the data behind this post: b3-airports-late-cancel-2025-26.csv · b3-carriers-late-cancel-2025-26.csv
Get this data
Every number in this post comes from the Airline On-Time Performance API – US Flight Delays and Cancellations. $0.0008 per row returned; every key gets $1 of free usage each month.
curl -X POST https://api.pushbuild.com/airline-on-time-performance/run \
  -H "X-API-Key: YOUR_KEY" \
  -H "Content-Type: application/json" \
-d '{"carriers": ["DL"], "origins": ["ATL"], "maxItems": 20}'Embed this chart
Free to reuse with the credit link. Paste this HTML into your page, or use the SVG file.
Want a table like this in Google Sheets, refreshed on demand? Free script: copy a web table into Google Sheets.
Related analysis
The flight that is late 61% of the time: United 1182, Columbus to Chicago
United 1182 from Columbus to O'Hare arrived 15+ minutes late on 61.2% of its 389 flights since January 2025, averaging 53.9 minutes late. Frontier…
Planes now wait 28.8 minutes to take off at JFK, the longest since at least 2018
The average taxi-out at JFK was 28.8 minutes in 2025, up from 21.1 in 2021; O'Hare's rose from 20.8 in 2022 to 28.9 so far in 2026. Atlanta is…
Airlines reported 20,426 cracks to the FAA since January 2025
Of 118,407 mechanical-difficulty reports filed since January 2025, 20,426 describe a crack. The parts reported most were fuselage skin (6,782), seat…


Want this data inside your own app or CRM? API integrations and data sync