
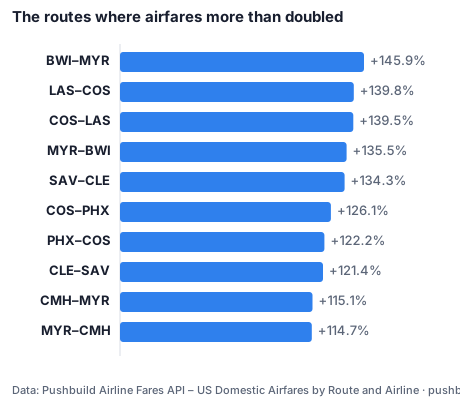
The routes where airfares more than doubled
Published 2026-11-07 · By Pushbuild · Data: Airline Fares API – US Domestic Airfares by Route and Airline
The average fare from Baltimore to Myrtle Beach went from $74 in 2019 to $182; Colorado Springs to Las Vegas from $81 to $194.
“TranStats provides one-stop shopping for intermodal transportation data for researchers, decision-makers, as well as the general public interested in transportation issues.”
— Bureau of Transportation Statistics, Airline Origin and Destination Survey (DB1B)
| Route | 2019 fare | Last 4 quarters | Change | Passengers (last 4q) |
|---|---|---|---|---|
| BWI–MYR | $74 | $182 | +145.9% | 175,680 |
| LAS–COS | $83 | $199 | +139.8% | 214,160 |
| COS–LAS | $81 | $194 | +139.5% | 213,760 |
| MYR–BWI | $76 | $179 | +135.5% | 182,240 |
| SAV–CLE | $102 | $239 | +134.3% | 62,280 |
| COS–PHX | $88 | $199 | +126.1% | 257,160 |
| PHX–COS | $90 | $200 | +122.2% | 257,160 |
| CLE–SAV | $103 | $228 | +121.4% | 63,720 |
| CMH–MYR | $93 | $200 | +115.1% | 46,480 |
| MYR–CMH | $95 | $204 | +114.7% | 45,360 |
| MCO–COS | $140 | $297 | +112.1% | 87,280 |
| EUG–OAK | $84 | $177 | +110.7% | 57,200 |
Caveats
The data does not say why fares changed.
Sources
- Bureau of Transportation Statistics, Airline Origin and Destination Survey (DB1B), read through the Pushbuild Airline Fares API on 2026-11-07
Data as of 2026-11-07. Every figure in this post is in the table above and the CSV below.
Download the data behind this post: b3-fares-change-2019-vs-last-4q.csv
Get this data
Every number in this post comes from the Airline Fares API – US Domestic Airfares by Route and Airline. $0.0008 per row returned; every key gets $1 of free usage each month.
curl -X POST https://api.pushbuild.com/airline-fares/run \
  -H "X-API-Key: YOUR_KEY" \
  -H "Content-Type: application/json" \
-d '{"origins": ["BOS"], "maxItems": 20}'Embed this chart
Free to reuse with the credit link. Paste this HTML into your page, or use the SVG file.
Want a table like this in Google Sheets, refreshed on demand? Free script: copy a web table into Google Sheets.
Related analysis
Airfares rose 8% since 2019 while prices rose 24%
On the median route with 40,000+ passengers, the average fare in the four quarters to mid-2025 was 8.4% above 2019. Consumer prices rose 24.3% over…
Dallas to Oklahoma City: $380 for 175 miles
The most expensive busy routes per mile are short hub hops: DFW–OKC averages $380 (217.1¢ a mile) and LAX–San Diego $233. Many of these passengers…
Airlines reported 20,426 cracks to the FAA since January 2025
Of 118,407 mechanical-difficulty reports filed since January 2025, 20,426 describe a crack. The parts reported most were fuselage skin (6,782), seat…


Want this data inside your own app or CRM? API integrations and data sync