
How accurate were the 2026 midterm polls? They missed the Democratic surge by 4 points
Published 2026-11-07 · By Pushbuild · Data: US Political Polls 2026 – Senate, Governor, Approval, Election Night Results API – Live State Returns
Final-stretch polls understated Democrats in 168 of 215 cases. Across 216 polls in 31 Senate and governor races, the average poll was 4.1 points too Republican on the Democrat-minus-Republican margin, and off by 6 points either way. 34 polls showed the wrong candidate ahead and 12 more showed a tie.
Where the polls missed most
| Race | Winner | Result | Poll average | Polls | Polling miss |
|---|---|---|---|---|---|
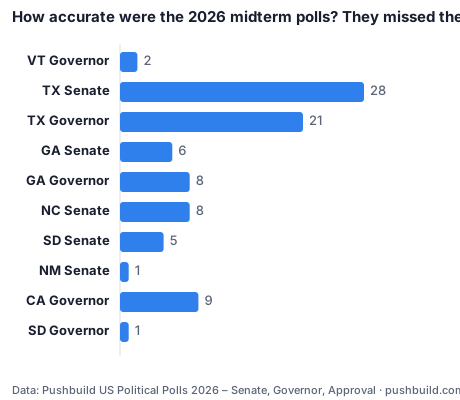
| VT Governor | Phil Scott (R) | R+6.6 | D+2.5 | 2 | 9.1 pts too Democratic |
| TX Senate | James Talarico (D) | D+12.1 | D+3.1 | 28 | 9 pts too Republican |
| TX Governor | Gina Hinojosa (D) | D+7.1 | R+1.9 | 21 | 9 pts too Republican |
| GA Senate | Jon Ossoff (D) | D+18 | D+9.2 | 6 | 8.9 pts too Republican |
| GA Governor | Keisha Lance Bottoms (D) | D+8.7 | R+0.2 | 8 | 8.9 pts too Republican |
| NC Senate | Roy Cooper (D) | D+19.6 | D+10.9 | 8 | 8.7 pts too Republican |
| SD Senate | Mike Rounds (R) | R+21 | R+12.8 | 5 | 8.2 pts too Democratic |
| NM Senate | Ben R Lujan (D) | D+26.5 | D+19 | 1 | 7.5 pts too Republican |
| CA Governor | Xavier Becerra (D) | D+30.4 | D+23.4 | 9 | 7 pts too Republican |
| SD Governor | Larry Rhoden and Tony Venhuizen (R) | R+27 | R+20 | 1 | 7 pts too Democratic |
| ID Senate | Jim Risch (R) | R+23 | R+16.5 | 2 | 6.5 pts too Democratic |
| RI Senate | John F. Reed (D) | D+37.5 | D+31 | 1 | 6.5 pts too Republican |
Texas: 18 of 21 polls had the wrong winner
21 final polls of the Texas governor's race; 18 had Greg Abbott ahead. The poll average was Abbott +1.9. Gina Hinojosa won by 7.1. In the Senate race the average was Talarico +3.1 and he won by 12.1; Trafalgar's last poll had it tied at 48-48.
The misses that ran the other way
It was not uniform. Polls overstated the non-Republican side in Vermont (Phil Scott won by 6.6 with the two-poll average at Janoo +2.5), South Dakota (Rounds +21.0 against a +12.8 average), Idaho and Nebraska. These are smaller, lightly polled states; the big misses toward Republicans were in heavily polled ones.
How we measured
Every general-election poll ending in the last three weeks, matched to the two candidates who finished first and second. Each pollster's polls count separately. Results are unofficial and will move as counties certify.
Sources
- US Political Polls 2026 – Senate, Governor, Approval: the primary sources are listed on the API page, read on 2026-11-07
- Election Night Results API – Live State Returns: the primary sources are listed on the API page, read on 2026-11-07
Data as of 2026-11-07. Every figure in this post is in the table above and the CSV below.
Download the data behind this post: midterms-polls-vs-results-2026.csv · midterms-poll-errors-2026.csv
Get this data
Every number in this post comes from the US Political Polls 2026 – Senate, Governor, Approval. $0.0001 per row returned; every key gets $1 of free usage each month.
curl -X POST https://api.pushbuild.com/political-polls/run \
  -H "X-API-Key: YOUR_KEY" \
  -H "Content-Type: application/json" \
-d '{"states": "GA,ME,MI,NC", "maxItems": 20}'Get this data
Every number in this post comes from the Election Night Results API – Live State Returns. $0.0001 per row returned; every key gets $1 of free usage each month.
curl -X POST https://api.pushbuild.com/election-night-results/run \
  -H "X-API-Key: YOUR_KEY" \
  -H "Content-Type: application/json" \
-d '{"states": "NC,IA,CO", "year": 2022, "maxItems": 20}'Embed this chart
Free to reuse with the credit link. Paste this HTML into your page, or use the SVG file.
Want a table like this in Google Sheets, refreshed on demand? Free script: copy a web table into Google Sheets.
Related analysis
The pollster nobody cites beat them all in 2026
Survey 160 was the most accurate pollster of the 2026 Senate and governor races : four final polls (Minnesota and Ohio, Senate and governor), average…
Decided by 99 votes: the closest races of 2026
The closest race in our results is North Carolina's 5th district: Chuck Hubbard leads Virginia Foxx by 99 votes out of 285,498 (0.03 points), with…
The governors' money race is a dead heat: $216.8M vs $215.8M
The Republican Governors Association reported $216.8M in contributions in 2025-26 and the Democratic Governors Association $215.8M. The DGA had three…

Want this data inside your own app or CRM? API integrations and data sync