
The pollster nobody cites beat them all in 2026
Published 2026-11-07 · By Pushbuild · Data: US Political Polls 2026 – Senate, Governor, Approval, Election Night Results API – Live State Returns
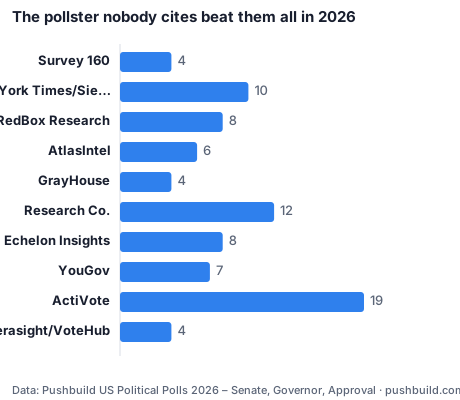
Survey 160 was the most accurate pollster of the 2026 Senate and governor races: four final polls (Minnesota and Ohio, Senate and governor), average error 1.4 points, every winner right. Among pollsters with five or more final polls, New York Times/Siena was best at 3.3 points across 10 races.
Every pollster with four or more final polls
| Pollster | Polls | Races | Avg error (pts) | Lean vs result | Wrong winner |
|---|---|---|---|---|---|
| Survey 160 | 4 | 4 | 1.4 | R+1.4 | 0 |
| New York Times/Siena University | 10 | 10 | 3.3 | R+1.5 | 0 |
| RedBox Research | 8 | 6 | 4.4 | R+4.1 | 0 |
| AtlasIntel | 6 | 6 | 4.7 | R+4 | 0 |
| GrayHouse | 4 | 3 | 4.8 | R+4.7 | 0 |
| Research Co. | 12 | 12 | 5.2 | R+4.7 | 1 |
| Echelon Insights | 8 | 8 | 5.2 | R+3.6 | 1 |
| YouGov | 7 | 7 | 5.8 | R+2.6 | 1 |
| ActiVote | 19 | 11 | 6.4 | R+6.3 | 4 |
| Verasight/VoteHub | 4 | 4 | 6.5 | R+6.5 | 1 |
| Beacon Research (D)/ Shaw & Co. Research (R) | 4 | 4 | 6.6 | R+5.5 | 1 |
| InsiderAdvantage | 9 | 8 | 7.1 | R+7.1 | 2 |
| Univision/YouGov | 4 | 4 | 7.3 | R+7.3 | 1 |
| Rasmussen Reports | 4 | 3 | 7.7 | R+7.7 | 1 |
| University of New Hampshire | 4 | 4 | 9 | D+0.7 | 1 |
| Emerson College | 7 | 6 | 9.1 | R+5.4 | 2 |
| Quantus Insights | 6 | 6 | 9.8 | R+9.8 | 3 |
| Concord Public Opinion Partners | 5 | 5 | 10 | D+9.7 | 3 |
"Lean vs result" is the average Democrat-minus-Republican error: R+4 means the pollster's margins were 4 points too Republican.
The two that missed by 10
Concord Public Opinion Partners had Pete Ricketts losing Nebraska by 7; he won by 6.2. It had Mike Rounds losing South Dakota by 2; he won by 21.0. Quantus Insights had James Talarico losing Texas by 1 (he won by 12.1) and Roy Cooper up 8 in North Carolina (he won by 19.6). They missed in opposite directions: Concord's lean was D+9.7, Quantus's R+9.8.
Caveats
Four polls is a small record; Survey 160 polled two states. Only polls in races our feed has full results for are scored.
Sources
- US Political Polls 2026 – Senate, Governor, Approval: the primary sources are listed on the API page, read on 2026-11-07
- Election Night Results API – Live State Returns: the primary sources are listed on the API page, read on 2026-11-07
Data as of 2026-11-07. Every figure in this post is in the table above and the CSV below.
Download the data behind this post: midterms-pollster-accuracy-2026.csv · midterms-poll-errors-2026.csv
Get this data
Every number in this post comes from the US Political Polls 2026 – Senate, Governor, Approval. $0.0001 per row returned; every key gets $1 of free usage each month.
curl -X POST https://api.pushbuild.com/political-polls/run \
  -H "X-API-Key: YOUR_KEY" \
  -H "Content-Type: application/json" \
-d '{"states": "GA,ME,MI,NC", "maxItems": 20}'Get this data
Every number in this post comes from the Election Night Results API – Live State Returns. $0.0001 per row returned; every key gets $1 of free usage each month.
curl -X POST https://api.pushbuild.com/election-night-results/run \
  -H "X-API-Key: YOUR_KEY" \
  -H "Content-Type: application/json" \
-d '{"states": "NC,IA,CO", "year": 2022, "maxItems": 20}'Embed this chart
Free to reuse with the credit link. Paste this HTML into your page, or use the SVG file.
Want a table like this in Google Sheets, refreshed on demand? Free script: copy a web table into Google Sheets.
Related analysis
How accurate were the 2026 midterm polls? They missed the Democratic surge by 4 points
Final-stretch polls understated Democrats in 168 of 215 cases. Across 216 polls in 31 Senate and governor races, the average poll was 4.1 points too…
Decided by 99 votes: the closest races of 2026
The closest race in our results is North Carolina's 5th district: Chuck Hubbard leads Virginia Foxx by 99 votes out of 285,498 (0.03 points), with…
The governors' money race is a dead heat: $216.8M vs $215.8M
The Republican Governors Association reported $216.8M in contributions in 2025-26 and the Democratic Governors Association $215.8M. The DGA had three…

Want this data inside your own app or CRM? API integrations and data sync