
California's Central Valley has one licensed child-care slot for every five young children
Published 2026-11-07 · By Pushbuild · Data: Child Care Providers API – Licensed Daycare Centers and Homes in 9 States
Kern County has 18.6 licensed slots per 100 children under 5, Tulare 17.1, Stanislaus 18.1. The lowest in our data is Juniata County, Pennsylvania, at 7.4. At the other end, Delaware statewide has 128.7 slots per 100 and Colorado's Summit County 166.5.
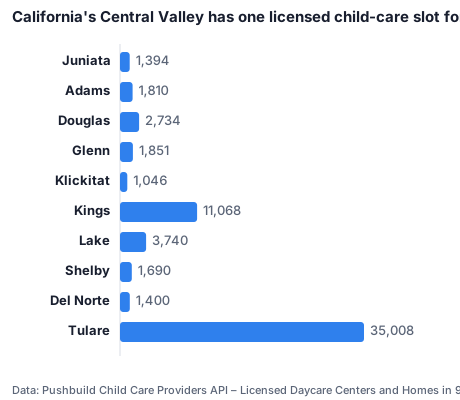
Fewest slots per 100 children under 5 (counties with 1,000+)
| County | State | Slots | Children under 5 | Per 100 |
|---|---|---|---|---|
| Juniata | PA | 103 | 1,394 | 7.4 |
| Adams | WA | 250 | 1,810 | 13.8 |
| Douglas | WA | 382 | 2,734 | 14.0 |
| Glenn | CA | 264 | 1,851 | 14.3 |
| Klickitat | WA | 158 | 1,046 | 15.1 |
| Kings | CA | 1,708 | 11,068 | 15.4 |
| Lake | CA | 599 | 3,740 | 16.0 |
| Shelby | TX | 284 | 1,690 | 16.8 |
| Del Norte | CA | 236 | 1,400 | 16.9 |
| Tulare | CA | 5,985 | 35,008 | 17.1 |
| San Benito | CA | 742 | 4,229 | 17.5 |
| Stevens | WA | 411 | 2,340 | 17.6 |
| Hill | TX | 383 | 2,114 | 18.1 |
| Stanislaus | CA | 6,788 | 37,447 | 18.1 |
| Kern | CA | 12,195 | 65,691 | 18.6 |
By state
| State | Slots | Children under 5 | Per 100 |
|---|---|---|---|
| CA | 742,751 | 2,214,141 | 33.5 |
| WA | 178,441 | 437,433 | 40.8 |
| PA | 411,598 | 685,379 | 60.1 |
| TX | 1,183,692 | 1,928,242 | 61.4 |
| NY | 708,155 | 1,102,961 | 64.2 |
| MA | 267,495 | 350,335 | 76.4 |
| CO | 261,857 | 315,470 | 83.0 |
| VT | 33,894 | 28,053 | 120.8 |
| DE | 70,206 | 54,545 | 128.7 |
Caveats
Licensed capacity counts school-age slots too, so places above 100 are possible. Connecticut is left out (capacity missing for most providers). Nine states.
Sources
- Child Care Providers API – Licensed Daycare Centers and Homes in 9 States: the primary sources are listed on the API page, read on 2026-11-07
Data as of 2026-11-07. Every figure in this post is in the table above and the CSV below.
Download the data behind this post: b2-childcare-county-extremes.csv · b2-childcare-slots-per-100-under5-by-state.csv
Get this data
Every number in this post comes from the Child Care Providers API – Licensed Daycare Centers and Homes in 9 States. $0.0008 per row returned; every key gets $1 of free usage each month.
curl -X POST https://api.pushbuild.com/child-care-providers/run \
  -H "X-API-Key: YOUR_KEY" \
  -H "Content-Type: application/json" \
-d '{"maxItems": 20}'Embed this chart
Free to reuse with the credit link. Paste this HTML into your page, or use the SVG file.
Want a table like this in Google Sheets, refreshed on demand? Free script: copy a web table into Google Sheets.
Related analysis
Texas foster agencies and residential centers average more than twice the violations of daycares
Texas general residential operations averaged 7.8 cited violations over three years and child-placing agencies 7.9, against 3.0 for licensed…
Most rated daycares sit at the bottom of their state's star scale
In Pennsylvania 2,966 providers are at STAR 1, the lowest of four levels, against 2,280 at STAR 4. In Colorado 1,380 are at level 1 of 5 and 181 at…
Special-needs plans grew 157% since 2020
Enrollment in Medicare special-needs plans rose from 3.27 million in January 2020 to 8.40 million in October 2026; other Medicare Advantage plans…


Want this data inside your own app or CRM? API integrations and data sync