
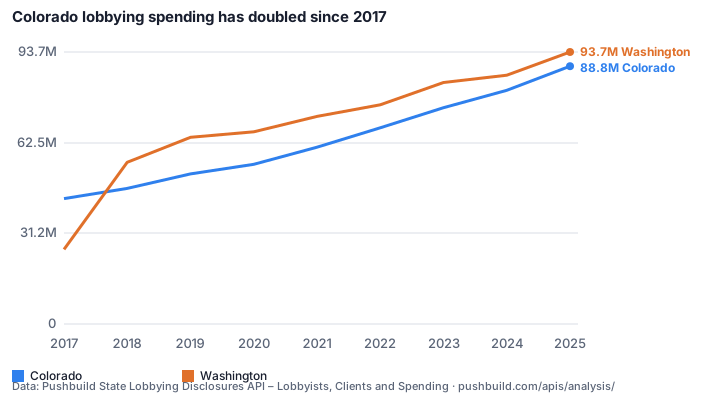
Colorado lobbying spending has doubled since 2017
Published 2026-11-07 · By Pushbuild · Data: State Lobbying Disclosures API – Lobbyists, Clients and Spending
Lobbyist compensation reported in Colorado rose from $43.2M in 2017 to $88.8M in 2025. Washington rose from $55.7M (2018) to $93.7M, and New York from $267.8M (2019) to $348.3M. All three set records in 2025.
| Year | Colorado | New York | Washington |
|---|---|---|---|
| 2017 | $43.2M | $25.7M | |
| 2018 | $46.7M | $55.7M | |
| 2019 | $51.7M | $267.8M | $64.3M |
| 2020 | $55.0M | $262.6M | $66.2M |
| 2021 | $60.9M | $276.8M | $71.5M |
| 2022 | $67.6M | $306.1M | $75.5M |
| 2023 | $74.5M | $322.2M | $83.2M |
| 2024 | $80.5M | $338.7M | $85.7M |
| 2025 | $88.8M | $348.3M | $93.7M |
Caveats
Compensation paid to lobbyists as each state reports it; New York data starts in 2019 and Washington's 2017 figure looks partial. Not adjusted for inflation.
Sources
- State Lobbying Disclosures API – Lobbyists, Clients and Spending: the primary sources are listed on the API page, read on 2026-11-07
Data as of 2026-11-07. Every figure in this post is in the table above and the CSV below.
Download the data behind this post: b1-lobbying-compensation-by-year.csv
Get this data
Every number in this post comes from the State Lobbying Disclosures API – Lobbyists, Clients and Spending. $0.0008 per row returned; every key gets $1 of free usage each month.
curl -X POST https://api.pushbuild.com/state-lobbying-disclosures/run \
  -H "X-API-Key: YOUR_KEY" \
  -H "Content-Type: application/json" \
-d '{"states": ["CO"], "client": "Microsoft", "maxItems": 20}'Embed this chart
Free to reuse with the credit link. Paste this HTML into your page, or use the SVG file.
Want a table like this in Google Sheets, refreshed on demand? Free script: copy a web table into Google Sheets.
Related analysis
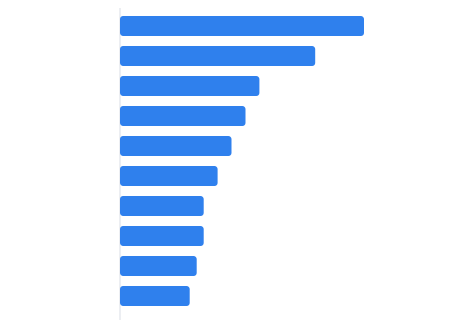
A casino company was New York's biggest lobbying client in 2025
Genting New York paid $3.5M to lobbyists in 2025, more than the Greater New York Hospital Association ($2.8M). Bally's and TSG Coney Island…
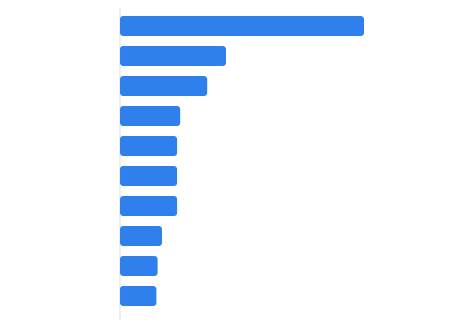
Healthcare is Colorado's biggest lobbying industry, more than double education
389 of Colorado's 2,549 lobbying clients registered in 2025 list healthcare/medical as their industry, against 169 for…
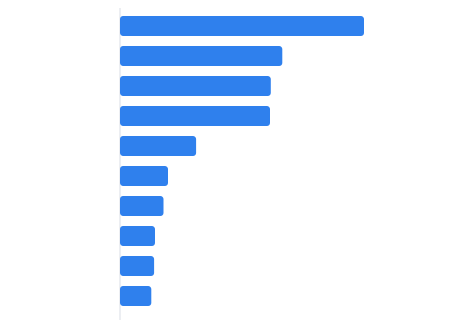
The governors' money race is a dead heat: $216.8M vs $215.8M
The Republican Governors Association reported $216.8M in contributions in 2025-26 and the Democratic Governors Association $215.8M. The DGA had three…

Want this data inside your own app or CRM? API integrations and data sync