
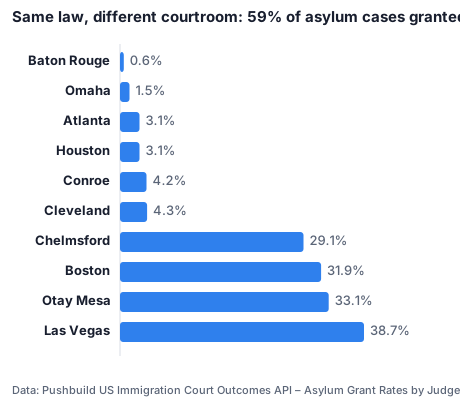
Same law, different courtroom: 59% of asylum cases granted in Sacramento, 0.6% in Baton Rouge
Published 2026-11-07 · By Pushbuild · Data: US Immigration Court Outcomes API – Asylum Grant Rates by Judge and Court
In fiscal 2025-26, Sacramento's immigration court granted 59.2% of decided asylum cases and Houston's 3.1% (549 grants, 17,431 denials). 4 judges with 300+ decisions granted none.
By court (1,000+ decisions)
| Court | Granted | Denied | Grant rate |
|---|---|---|---|
| Baton Rouge | 10 | 1,795 | 0.6% |
| Omaha | 42 | 2,740 | 1.5% |
| Atlanta | 175 | 5,417 | 3.1% |
| Houston | 549 | 17,431 | 3.1% |
| Conroe | 71 | 1,619 | 4.2% |
| Cleveland | 191 | 4,221 | 4.3% |
| Chelmsford | 964 | 2,344 | 29.1% |
| Boston | 1,697 | 3,617 | 31.9% |
| Otay Mesa | 405 | 819 | 33.1% |
| Las Vegas | 591 | 937 | 38.7% |
| San Francisco | 2,805 | 3,717 | 43.0% |
| Sacramento | 1,348 | 928 | 59.2% |
Judges at the extremes (300+ decisions)
| Judge | Court | Granted | Denied | Rate |
|---|---|---|---|---|
| Chen, Shuting | San Francisco | 265 | 102 | 72.2% |
| Adams, Lori | New York | 212 | 101 | 67.7% |
| Gordon, Louis A. | San Francisco | 213 | 156 | 57.7% |
| Badrinath, Vikram | Sacramento | 270 | 208 | 56.5% |
| Burman, Lawrence O. | Annandale | 168 | 142 | 54.2% |
| Gover, Erin | Boston | 352 | 304 | 53.7% |
| Wang, Lynn | Houston | 1 | 410 | 0.2% |
| Burns, John | New York | 2 | 1084 | 0.2% |
| Pobjecky, Artie | Houston | 0 | 366 | 0.0% |
| Garten, Danielle H. | Houston | 0 | 327 | 0.0% |
| Holliday, Carey R. | Baton Rouge | 0 | 710 | 0.0% |
| Nazaire, Karen | Newark | 0 | 478 | 0.0% |
Caveats
Courts hear different mixes of nationalities and detained cases, which explains part of the gap.
Sources
- Executive Office for Immigration Review, FOIA library, read through the Pushbuild US Immigration Court Outcomes API on 2026-11-07
Data as of 2026-11-07. Every figure in this post is in the table above and the CSV below.
Download the data behind this post: b2-asylum-grant-rate-by-court-fy25-26.csv · b2-asylum-grant-rate-by-judge-fy25-26.csv
Get this data
Every number in this post comes from the US Immigration Court Outcomes API – Asylum Grant Rates by Judge and Court. $0.0016 per row returned; every key gets $1 of free usage each month.
curl -X POST https://api.pushbuild.com/immigration-court-outcomes/run \
  -H "X-API-Key: YOUR_KEY" \
  -H "Content-Type: application/json" \
-d '{"groupBy": ["fiscalYear", "court"], "application": "asylum", "fiscalYearFrom": 2025, "maxItems": 20}'Embed this chart
Free to reuse with the credit link. Paste this HTML into your page, or use the SVG file.
Want a table like this in Google Sheets, refreshed on demand? Free script: copy a web table into Google Sheets.
Related analysis
The asylum grant rate fell from 43% to 7% in two years
Immigration judges granted 37,126 asylum applications and denied 48,540 in fiscal 2024, a 43.3% grant rate. In fiscal 2026 they granted 10,903 and…
Venezuelans' asylum grant rate fell from 56% to 7%
In fiscal 2024, 56.4% of decided Venezuelan asylum cases were granted; in fiscal 2026, 6.8%. Indians fell from 60.8% to 4.9%, Chinese from 72.1% to…
Half of all public comments on open federal rules are on one Alaska oil proposal
The Bureau of Land Management's proposal on production sites in the National Petroleum Reserve in Alaska had 72,576 public comments on November 7,…

Want this data inside your own app or CRM? API integrations and data sync